If you're doing quantitative market research, in most cases, the sample size for the number of respondents you'll test is determined by your available budget and by the confidence levels that you desire or can accept.
The larger the sample size, the greater degree of accuracy, not only for predictions of total population behavior, but also for the degree of variation in that behavior.
This is the basis for determining confidence levels in predictability of the test base compared to the entire target population. The larger the sample size, the smaller the standard error — the possibility that the test results will not mirror the behavior of the target population. On the other hand, if your sample grows beyond a certain size, you will not greatly increase your accuracy level, but you will definitely incur more research costs.
Even for small companies, the best recommendation for choosing the optimum sample size is to consult a professional market researcher or a nearby school with a statistics department for help in designing, constructing questionnaires, conducting the research, and analyzing results.
Some statistical background. At least 100 test respondents should be selected from a probability sample for all quantitative tests with the objective of 68 percent to 95 percent confidence levels in predictability of test results.
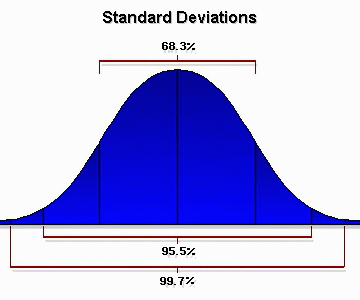
When sample sizes are at least 100, if the results are quantified and displayed on a graph, the results will tend to approximate what is called the "normal curve" of distribution. That is, the majority of people will give you an "average" response, a smaller number will give you a "below average" or an "above average" response, and a very small number will give you an "exceptionally below average" or an "exceptionally above average" response. This distribution is also known as a bell curve. The mathematical probability that a given test observation will fall within a range of values from the middle of this normal distribution curve is called a "standard deviation."

There is a direct relationship between your sample size and the degree of reliability, based on the statistically predictable behavior of respondents' test results clustering in the pattern of a normal curve. This is the basis for quantifying the confidence level of test results, e.g., stating that you can have a 95 percent confidence level that your test results mirror the general population.
Mathematically, under a normal curve, 68.3 percent of all observations fall
within plus (+) or minus (-) one standard deviation of the middle of the curve;
95.5 percent of test observations fall within two standard deviations of the
middle of the normal curve and 99.7 percent of test observations fall within
three standard deviations. The key point is that the larger the sample size,
the greater the probability that the test results will fall within one to two
standard deviations of the middle of the normal curve of population behavior.